
Glances is a cross-platform monitoring tool which aims to present a maximum of information in a minimum of space through a curses or Web based interface. It can adapt dynamically the displayed information depending on the terminal size.
It can also work in client/server mode. Remote monitoring could be done via terminal, Web interface or API (XMLRPC and RESTful).
Glances is written in Python and uses the psutil library to get information from your system.
Stats can also be exported to external time/value databases.
换了家里的工程机之后就安装了这个工具,之所以一直没写是因为web端加载有问题,出不来页面。尝试通过pip升级之后一切正常了:
sudo pip3 install --upgrade glances
web页面效果:
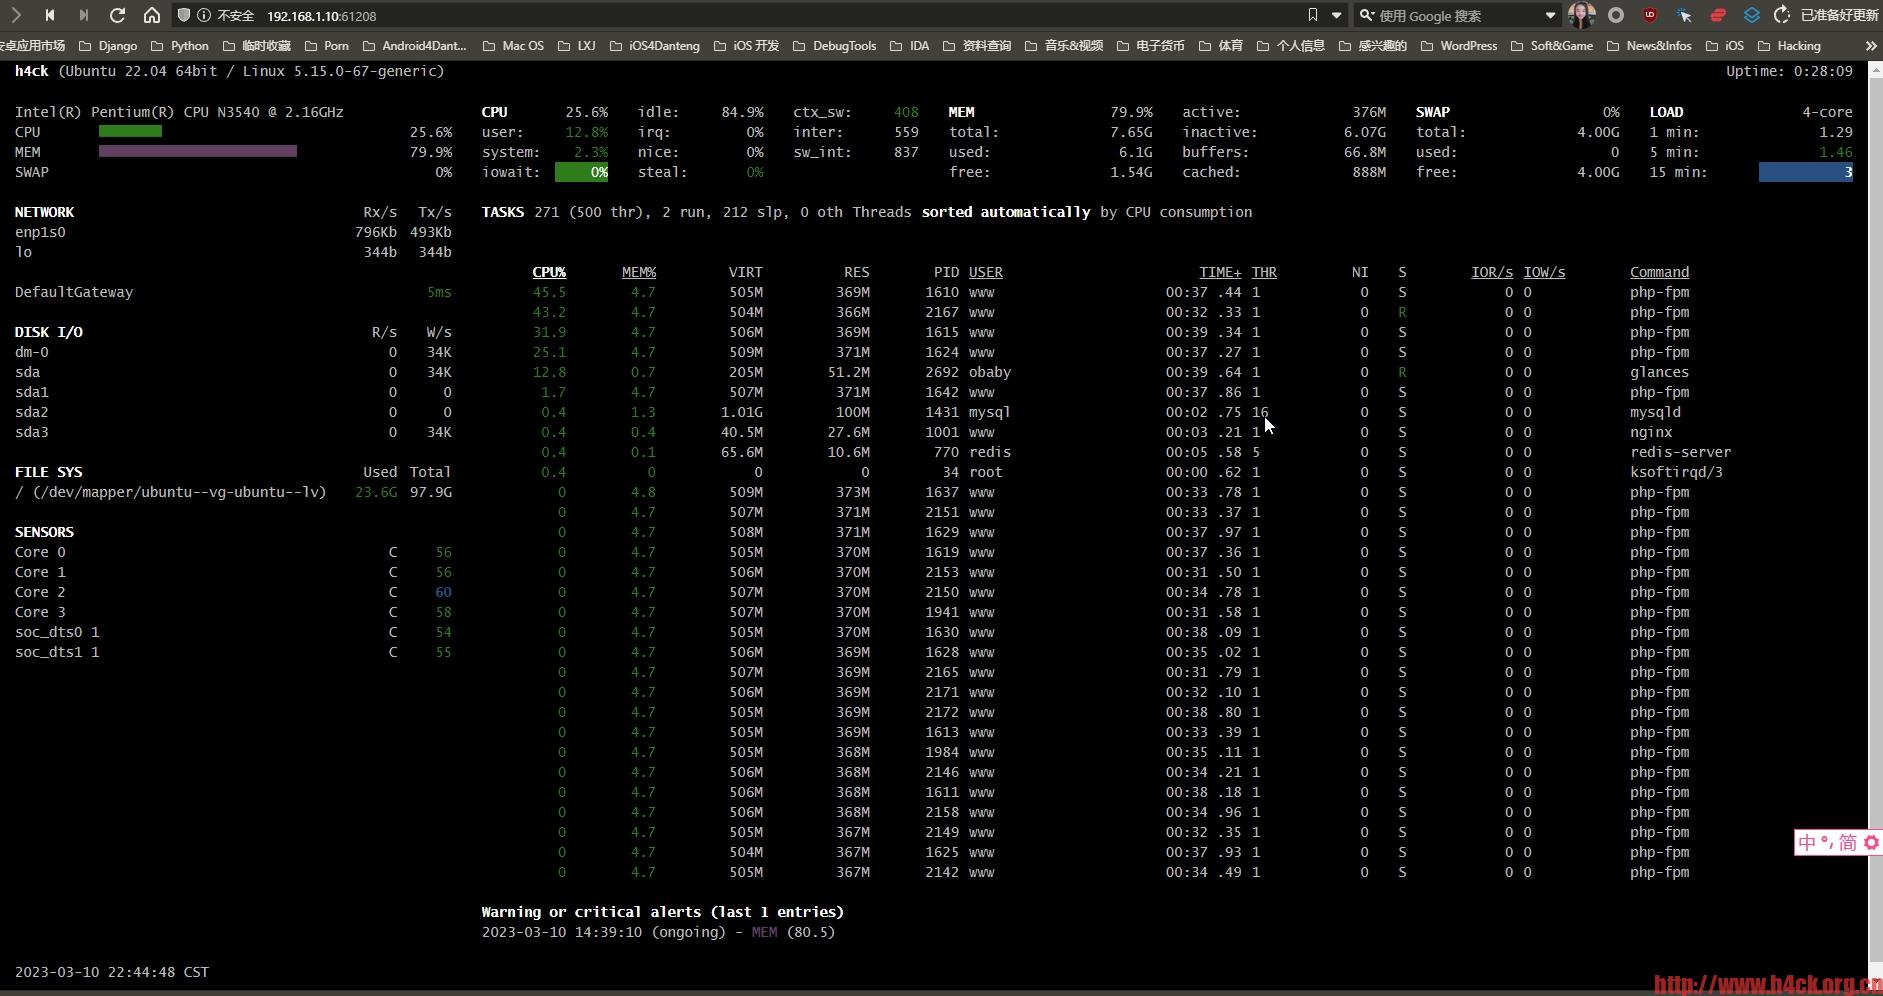
命令行效果:

功能:
◆CPU 平均负载
◆不同状态(如活动、休眠)进程的数量
◆所有内存信息,如物理内存、交换空间、空闲内存
◆CPU 信息
◆网络连接的上行/下行速度
◆磁盘 I/O 读/写速度详细信息
◆当前挂载设备的磁盘使用情况
◆消耗资源最多的进程和他们的 CPU/内存使用情况
颜色含义:
◆绿色:正常(OK)
◆蓝色:小心(careful)
◆紫色:警告(warning)
◆红色:致命(critical)
默认设置下,Glances 的阀值设置是:careful=50,warning=70,critical=90。你可以通过 “/etc/glances/” 目录下的默认配置文件 glances.conf 来自定义这些阀值。
快捷键:
Glances 提供了很多快捷键,可以在它运行时,用来查找输出信息。

下面是一些常用的热键列表:
◆m:按内存占用排序进程
◆p:按进程名称排序进程
◆c:按 CPU 占用率排序进程
◆i:按 I/O 频率排序进程
◆a:自动排序进程
◆d:显示/隐藏磁盘 I/O 统计信息
◆f:显示/隐藏文件系统统计信息
◆s:显示/隐藏传感器统计信息
◆y:显示/隐藏硬盘温度统计信息
◆l:显示/隐藏日志
◆n:显示/隐藏网络统计信息
◆x:删除警告和严重日志
◆h:显示/隐藏帮助界面
◆q:退出
◆w:删除警告记录
链接:
https://github.com/nicolargo/glances
参考链接:
https://developer.aliyun.com/article/389795
2 comments
这个有用
效果还是可以的,挺直观。主要是也很美观